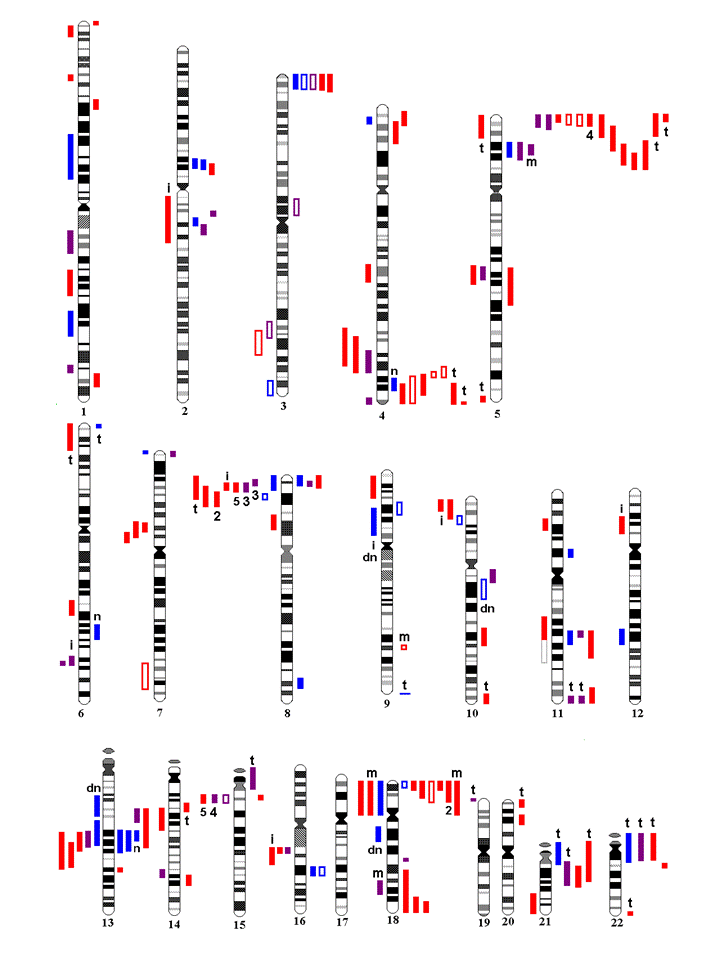
Unbalanced chromosome abnormality (UBCA) Chart
Click on a coloured bar for details
UBCA Chart
Idiograms with extent of duplications on the left hand side and deletions on the right hand side.
Group 1 imbalances are in blue, Group 2 in purple and Group 3 in red.
Filled coloured bars are UBCAs from peer reviewed papers; unfilled coloured boxes are from Abstracts only. Unfilled black boxes indicate alternative interpretations according to the authors concerned.
Figures in black give the number of times independent families with the same rearrangement have been reported (e.g. 4 etc).
Abbreviations: “t” indicates translocation, “i” insertion, “m” mosaicism in a parent and “n” the four exceptional Group 1 UBCAs that were not directly transmitted.
| Submission Form |
National Genetics Reference Laboratory
(Wessex)
Salisbury District Hospital
Salisbury
